A framework for reading hemp acreage and pricing data
Where the numbers come from, why published figures disagree with each other, and which series are worth tracking rather than quoting.
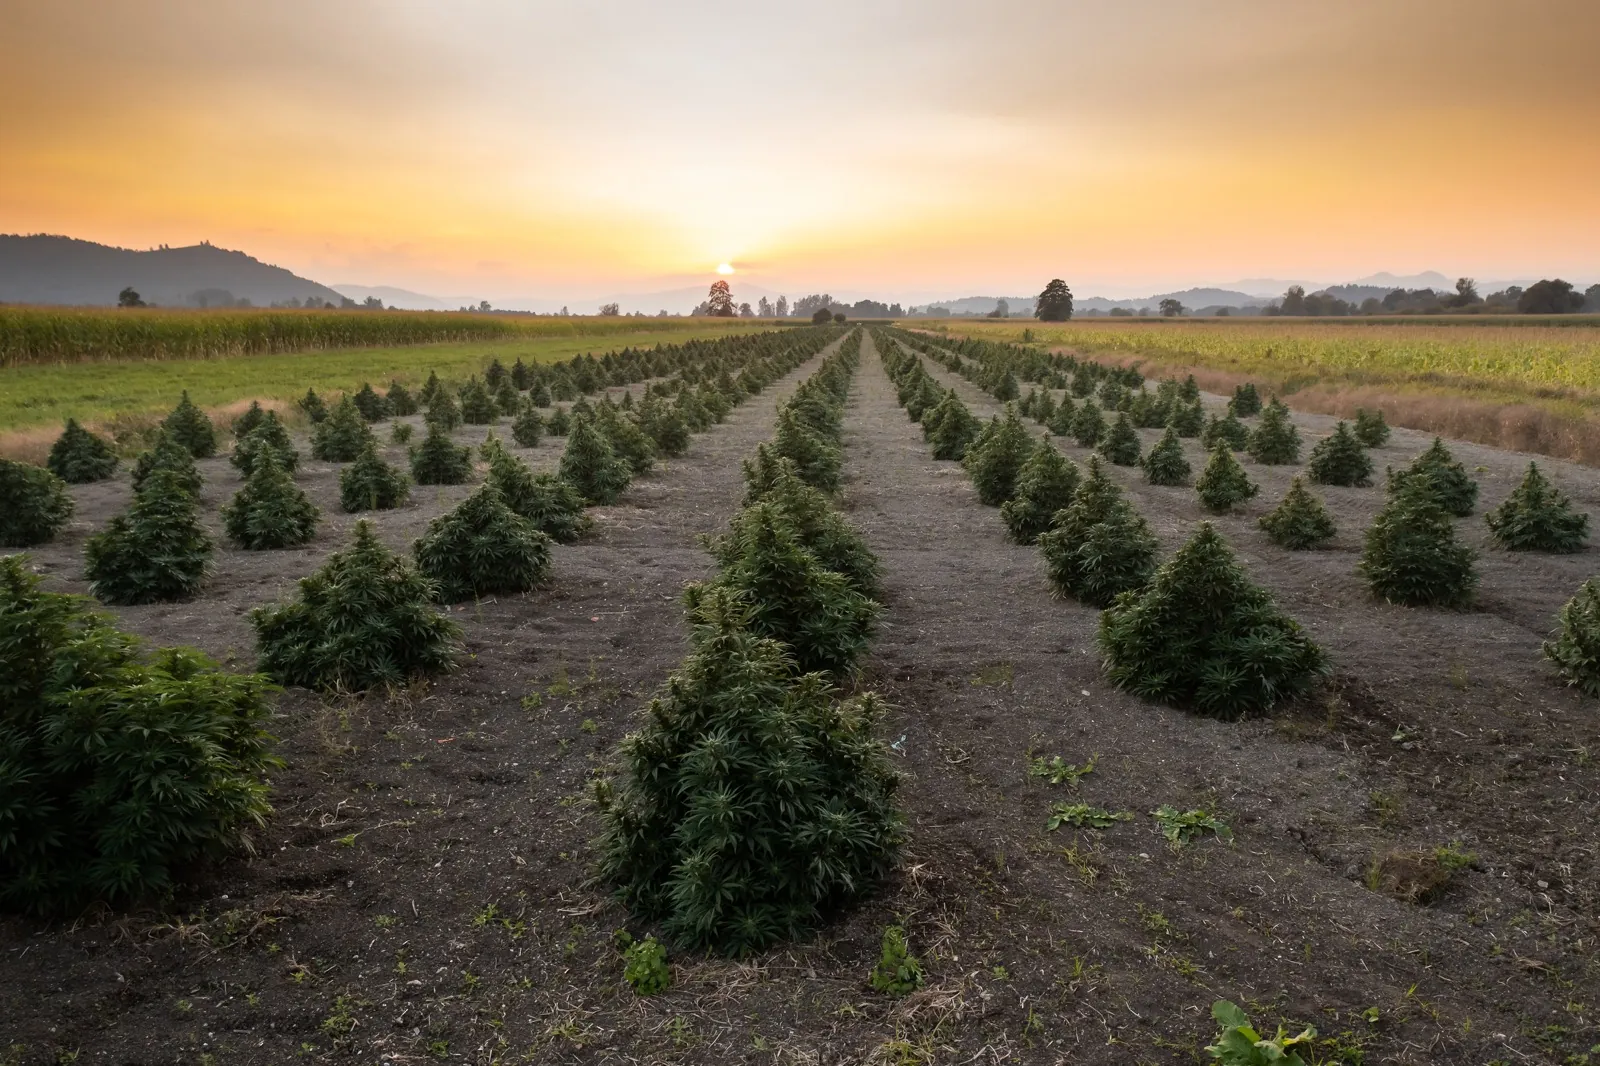
Aerial view of large hemp fields.
Hemp market figures circulate widely and agree with each other rarely. Before citing any of them - including in a business plan - it is worth understanding why they diverge.
Why published numbers disagree
Licensed acreage is not planted acreage is not harvested acreage. Growers commonly license more area than they plant, and plant more than they harvest. A single “acreage” figure can refer to any of the three and will differ by a wide margin depending on which.
Fiber, grain, and floral are different markets reported together. A ton of fiber and a kilogram of CBD-rich biomass are priced on unrelated logic. Aggregate “hemp acreage” merges them and obscures both.
Survey versus administrative data. Federal survey data and state licensing records are collected for different purposes with different coverage, timing, and non-response. Neither is wrong; they answer different questions.
Destroyed crop is inconsistently captured. Non-compliant crop destruction is a real and material loss line, and whether it appears in a given series varies.
Attribute every figure to a named series with a date, or do not print it. A number that cannot be traced to a source is not evidence - and in a market this volatile, an unsourced figure from two years ago is worse than no figure.
Series worth tracking
Rather than chase headline totals, track the underlying series directly:
- USDA National Agricultural Statistics Service hemp production reporting - the closest thing to an official national series for planted and harvested area, utilization, and value.
- State department of agriculture licensing reports - timelier than federal survey data and often broken out by intended use, which the national figures frequently are not.
- Processor and extractor pricing quotes - thin, negotiated, and not a public index, but the closest available signal on biomass and isolate pricing.
- Import and export data for hemp fiber and seed, which move on different drivers than the cannabinoid market entirely.
The structural question for the next 12 months
The November 12, 2026 definitional change alters demand composition, not just volume. If finished cannabinoid products face a 0.4 mg total-THC per-container cap, demand shifts along a predictable path:
- Down for high-trace-THC full-spectrum biomass
- Up for remediated distillate and isolate
- Largely unaffected for fiber and grain
Anyone forecasting a single “hemp market size” through that transition is averaging across segments moving in opposite directions. The segment-level view is the only one that will survive contact with the next year.
What we will and will not publish
We will publish figures with the series and date attached, and we will say when a number is an estimate from an interested party rather than a measurement - the frequently cited claim that roughly 95% of hemp-derived cannabinoid products would become unlawful under the new standard, for example, originates with the U.S. Hemp Roundtable, a trade group opposing the provision. That does not make it wrong. It does make it an estimate with a position behind it, and it should be read as one.
What we will not do is average conflicting sources into a confident-sounding round number. Where the data does not support a figure, we will say the data does not support a figure.
Editorial content only. This article is reporting and analysis, not medical, legal, or investment advice. Hemp and CBD regulations differ by state and change frequently. Verify current rules in your jurisdiction before making decisions.